Entity Visualization

Trace complex ownership structures visually

ReactReact FlowDagreAmazon Cognito
Role
Solutions Engineer and application developer
Context
Professional organization-chart and ownership analysis at Bitwise Industries / Stria
Implemented
Graph construction, automatic layout, relationship tracing, summaries, authentication, navigation, and print output
Constraint
Publish credible implementation evidence without exposing client entities, records, links, credentials, or infrastructure
Public scale
142 anonymized relationships across 10 charts and 73 entities
Status
Sanitized public edition with security, test, and production-build CI

I built Entity Visualization as a Solutions Engineer at Bitwise Industries / Stria. The application turns flat ownership records into an interactive organization chart where users can move through separate structures, follow an entity through its parent relationships, inspect ownership and distribution summaries, navigate with a minimap, and print the resulting view.

The public edition is deliberately not a copy of the former environment. Production identifiers, entity names, document URLs, deployment configuration, and legacy history remain private. The graph construction, Dagre layout, Cognito integration boundary, selection behavior, summaries, and print workflow remain reviewable against generated demonstration data.

01

From flat ownership records to a navigable graph

For the selected chart, the application deduplicates parent entities into nodes, converts each ownership record into a labeled edge, identifies top-level entities, and passes the result through Dagre for a top-to-bottom layout. Selecting a node recursively gathers its incoming relationships so the same workspace becomes both the overview and the trace surface.
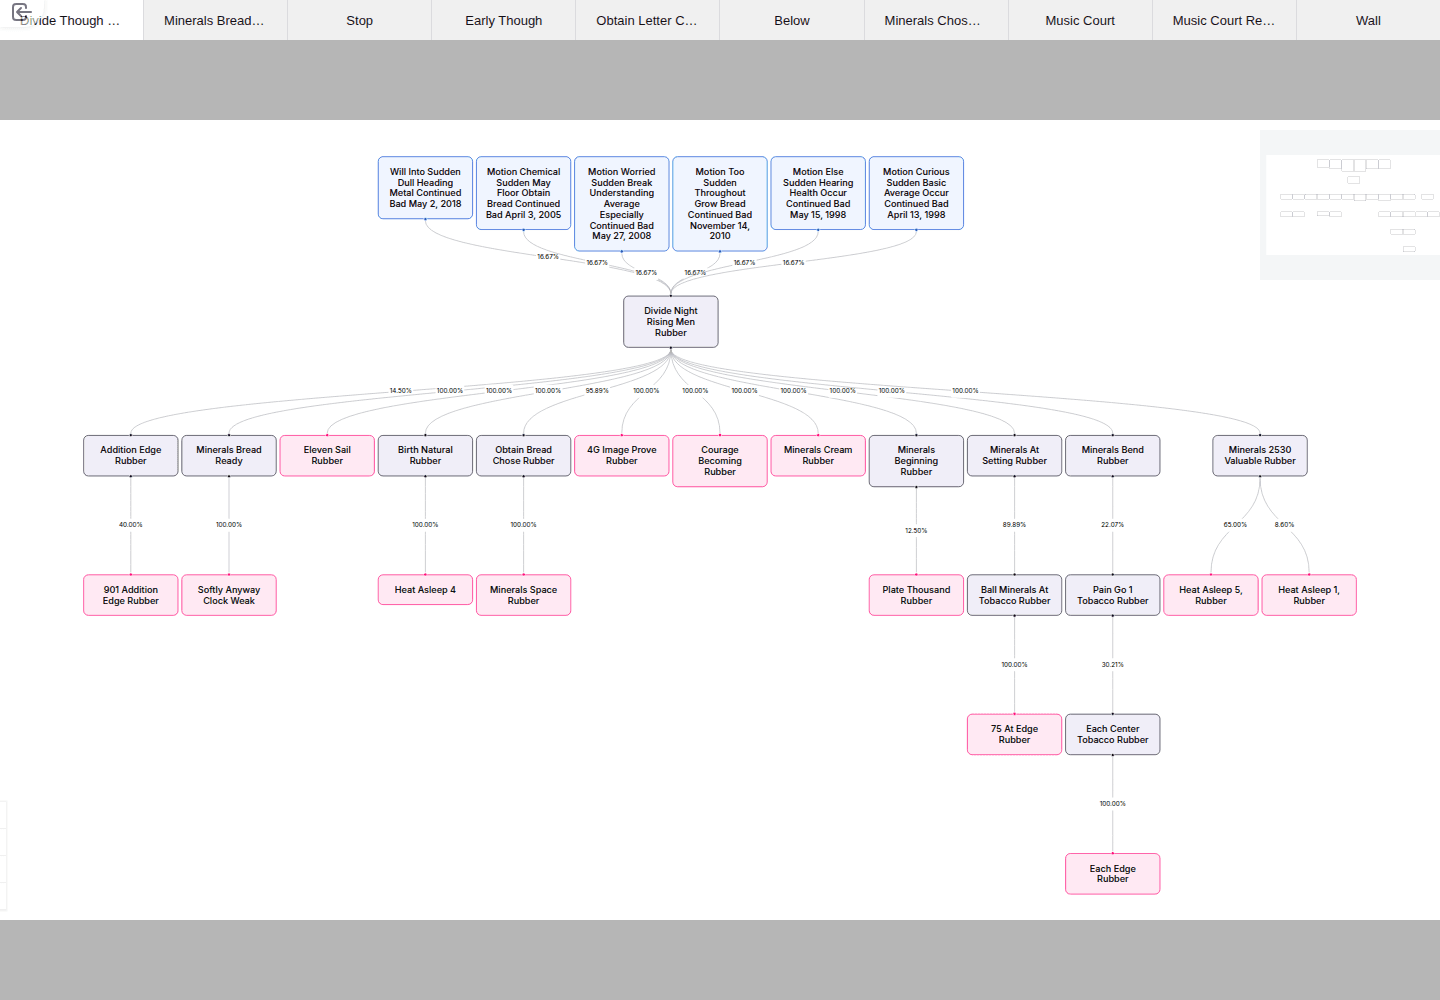
Entity Visualization displaying an automatically laid-out ownership graph with navigation and relationship details
02

Selection turns the overview into a relationship trace

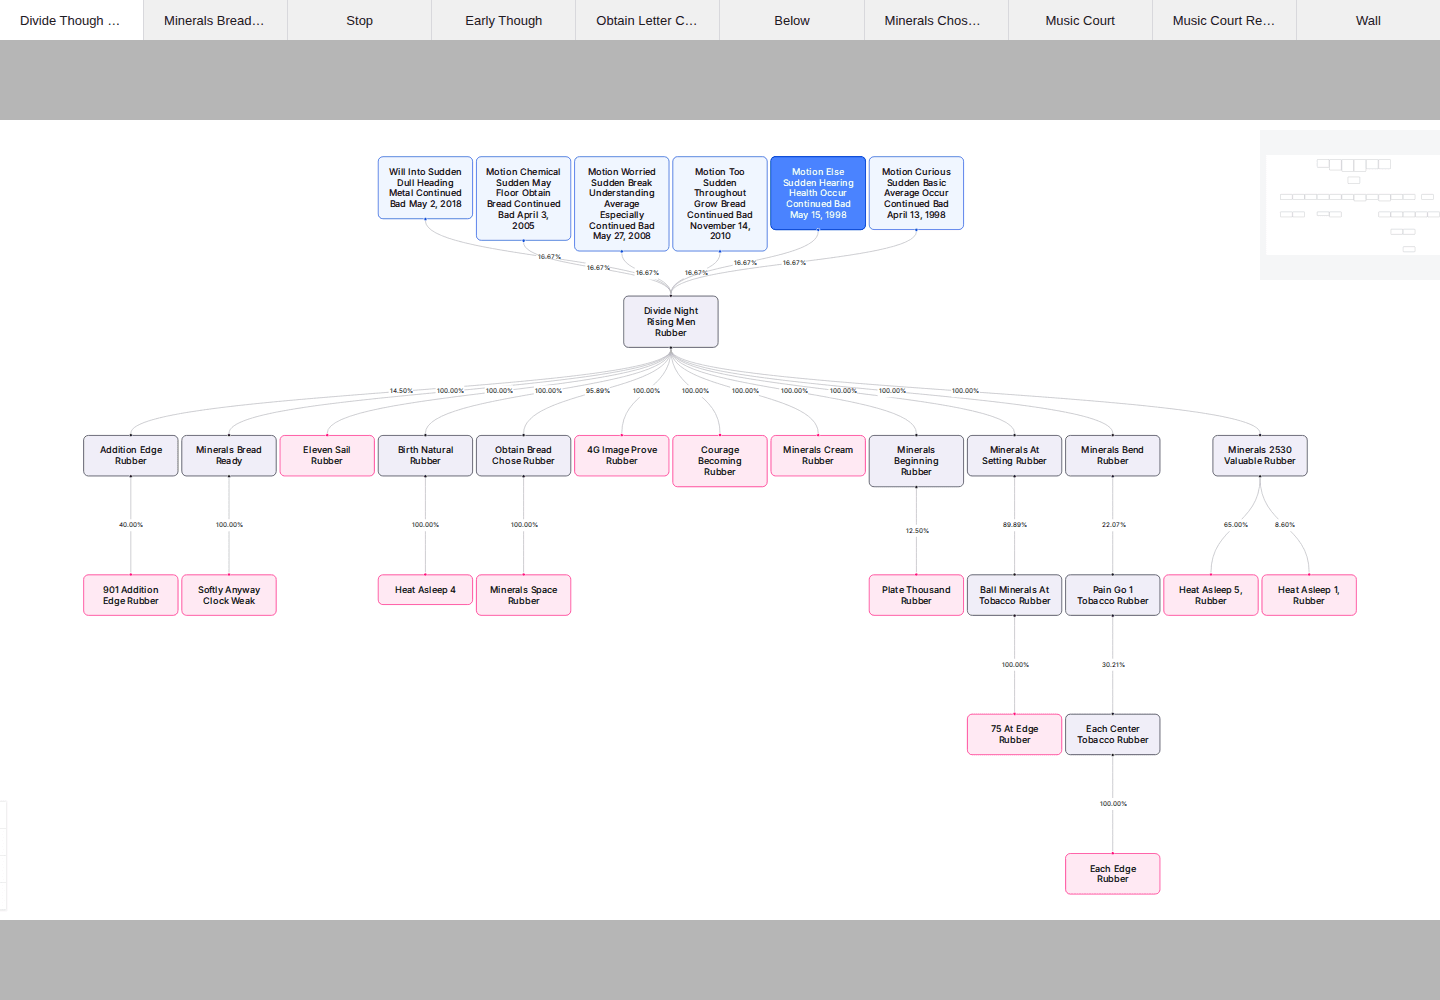
Selecting an entity marks it in blue and recursively follows its incoming ownership connections. The surrounding graph remains visible, so a user can understand the selected record in context instead of losing the broader structure in a separate detail screen.

Entity Visualization with one anonymized entity selected in blue and its ownership relationships visible across the graph

The public boundary is part of the engineering

Publishing professional work safely required more than renaming a few visible nodes. The active data was anonymized, environment-specific exports were removed, connected-record URLs were blanked, Cognito identifiers moved to local configuration, and the obsolete production deployment workflow was excluded.

The public repository begins with a clean sanitized history, while the former professional history remains private. That boundary makes the implementation inspectable without implying that the demonstration dataset, infrastructure, or credentials belong in a public portfolio.

  • src/components/Chart/index.jsBuilds nodes and ownership edges, applies Dagre layout, and recursively traces incoming relationships.
  • src/UserPool.jsKeeps Cognito configuration outside source and exposes the optional authentication boundary.
  • tests/repository.test.mjsGuards the public edition against professional identifiers and unsafe configuration guidance.
  • React Flow renders the graph and supplies pan, zoom, minimap, controls, selection, and connection traversal; Dagre calculates positions from the relationship topology.
  • Amazon Cognito is isolated behind environment-provided user-pool and client identifiers. Without that configuration, the public edition opens directly in demo mode against anonymized local data.
  • Repository tests reject professional document domains and known environment identifiers, while GitHub Actions runs dependency auditing, tests, and a Vite production build on every change.

Like what you see? I'm available for full-stack and automation work.

Get in touch